In April 2019 I interviewed Lynsey Hawker from the King’s Fund using the Knowledge for Healthcare case study template. Lynsey attended an Impact Training session that I ran with Victoria Treadway at CILIP Headquarters in June 2017. I asked her about how she had used the learning from our training course, and what difference it had made to her work.
Summary of problem or reason for enquiry
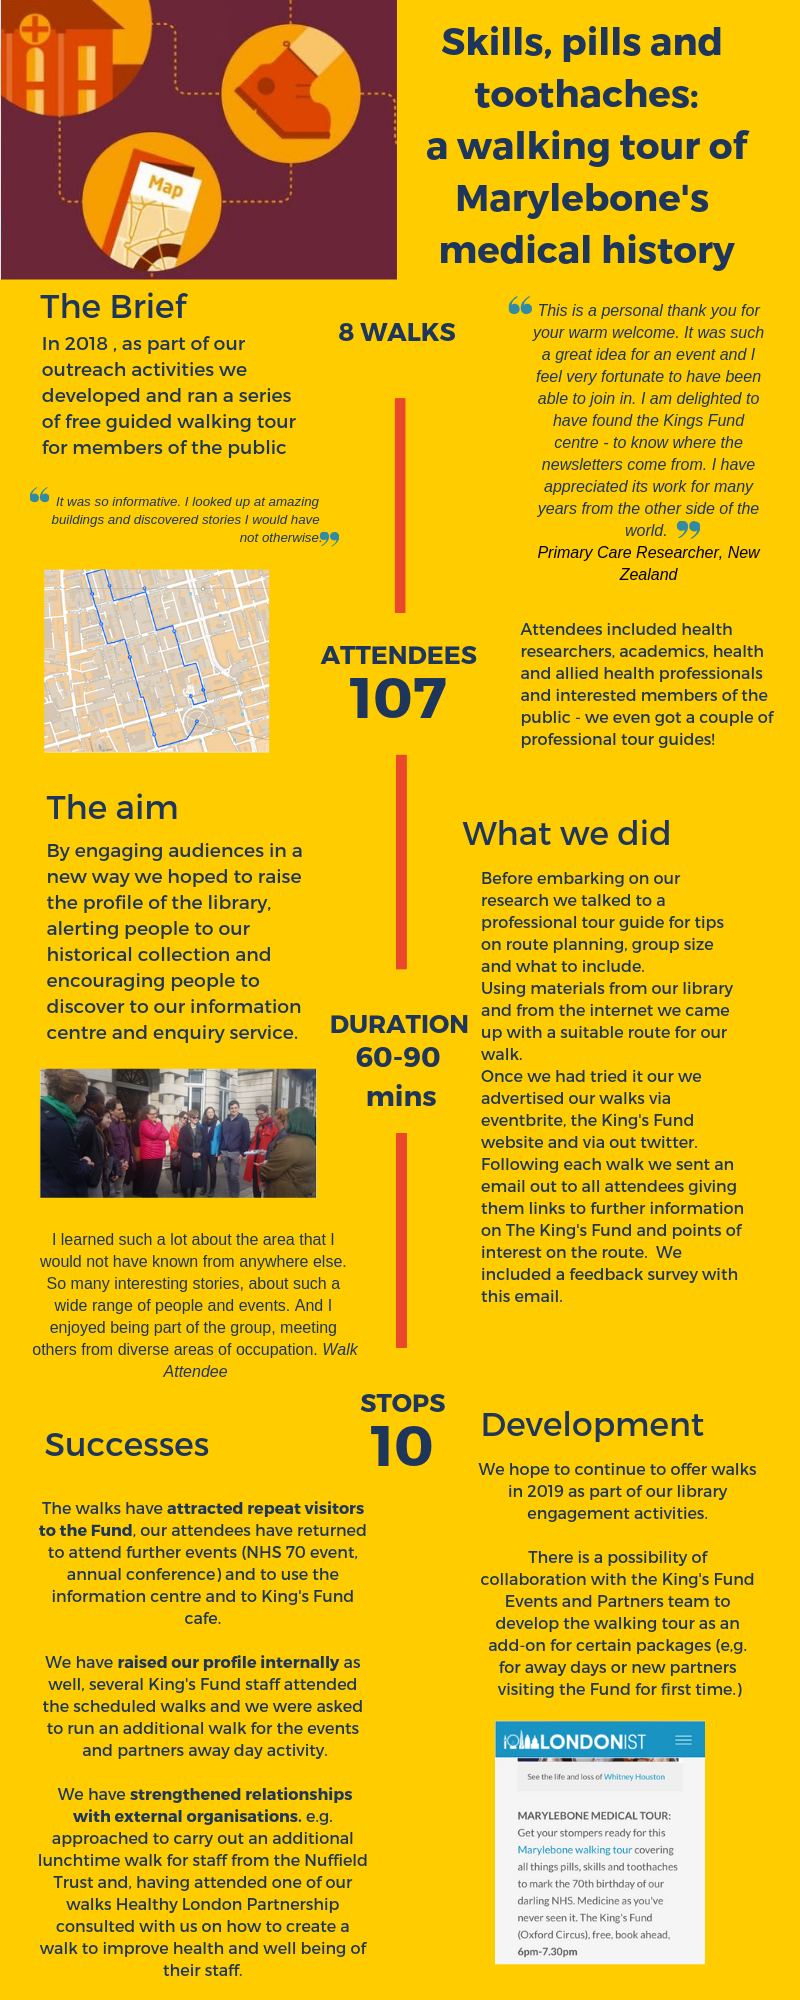
“We introduced free walking tours to members of the public to tell the story of how the King Fund had changed since it was established 120 years ago. We wanted to tell the story of the medical profession, show how the health service has changed and promote the historical collection. The tours start in the library and are circular tours, taking in the medical history of the area, including various royal colleges and other historical places.
We wanted to report the impact of the walking tours to senior stakeholders within the King’s Fund in a way that would have meaning for them. We used what we had learnt from the impact training session to show the difference that the walking tours made to participants”
Brief description of the information found / service provided
“I attended an impact training session in June 2017 at CILIP headquarters which was run by Tracey and Victoria. During the session I learnt about the resources available to help demonstrate impact, telling stories and using Canva.
Following on from the session, I had a think about how we could tell better stories about what we were doing. The walking tour was a bit different to our usual activities and their impact was not really shown in the numbers. We ran 8 walks and had 15 people per walk with 107 attendees in total.
I used Canva to create a poster bringing together the different work that we’d done. Although the total numbers looked quite small, by using Canva I was able to show the meaningful relationships that we had built with people for example a New Zealand holiday maker and a researcher who subsequently used Kings Fund resources. ”
Summary of outcome and impact
“My main takeaways from the impact training where how to use storytelling to make a compelling narrative. The numbers on their own don’t tell you very much, but when you look at who came along … we got more in touch with academics and members of the public who were interested in the Kings Fund.
I had heard of Canva before, but hadn’t used it. After the session I explored it more and found that it was a really easy way to make something that looks really professional. The final document went in our annual report and we have used it on social media to engage people.”
Immediate Impact
“The training helped me to think about how we can show impact. We are now more aware of this when we start something, that we think about how we can show the impact we are having in a more embedded way. We are able to use the resources to showcase our work to stakeholders.
The walking tours are something out of the ordinary, and being able to show the people that we reach is really important.
It has made people within the organisation more aware of library services. It’s really got people talking about the library and we have a new tour in the pipeline for this summer. As well as our normal walks we have also been able to work with other teams across the organisation to deliver walks to support things like team awaydays and provide walks for visitors to the Fund as part of wider events.
Doing something completely different like the walking tours, and then sharing the story in an impactful way has placed the library in the consciousness of more colleagues.”
Probable future Impact
“Having the MAP toolkit and workbook means that you’ve developed an approach that we can use to measure ongoing success. We will monitor the impact of the next round of walking tours in the summer.
We will also use the resources highlighted to run some interviews in the future for Berties Book Group and to assess impact of that.”
You can see the infographic that Lynsey produced in Canva by following this link.
Tagged: Canva, Impact training, Walking Tours